Note
Access to this page requires authorization. You can try signing in or changing directories.
Access to this page requires authorization. You can try changing directories.
In this guide, you learn how to set up a Microsoft Foundry metrics dashboard in Azure Managed Grafana. This dashboard tracks inference latency, throughput, token usage, and API call success rates to help you optimize costs, identify performance bottlenecks, and maintain the health of your AI resources.
What you can monitor
The Foundry dashboard provides real-time insights into your AI workloads:
- Model performance: Monitor inference latency, throughput, and success rates to identify bottlenecks
- Token usage: Track inference, prompt, and completion tokens across all deployments
- Request trends: View API call volume and success rates over time
- Cost tracking: Analyze token consumption patterns to understand and optimize costs
- Per-deployment comparison: Compare metrics across model deployments (for example, GPT-4, GPT-3.5)
Prerequisites
Before you begin, ensure you have:
- An Azure account with an active subscription. Create an account for free.
- An Azure Managed Grafana workspace. If you don't have one yet, create an Azure Managed Grafana workspace.
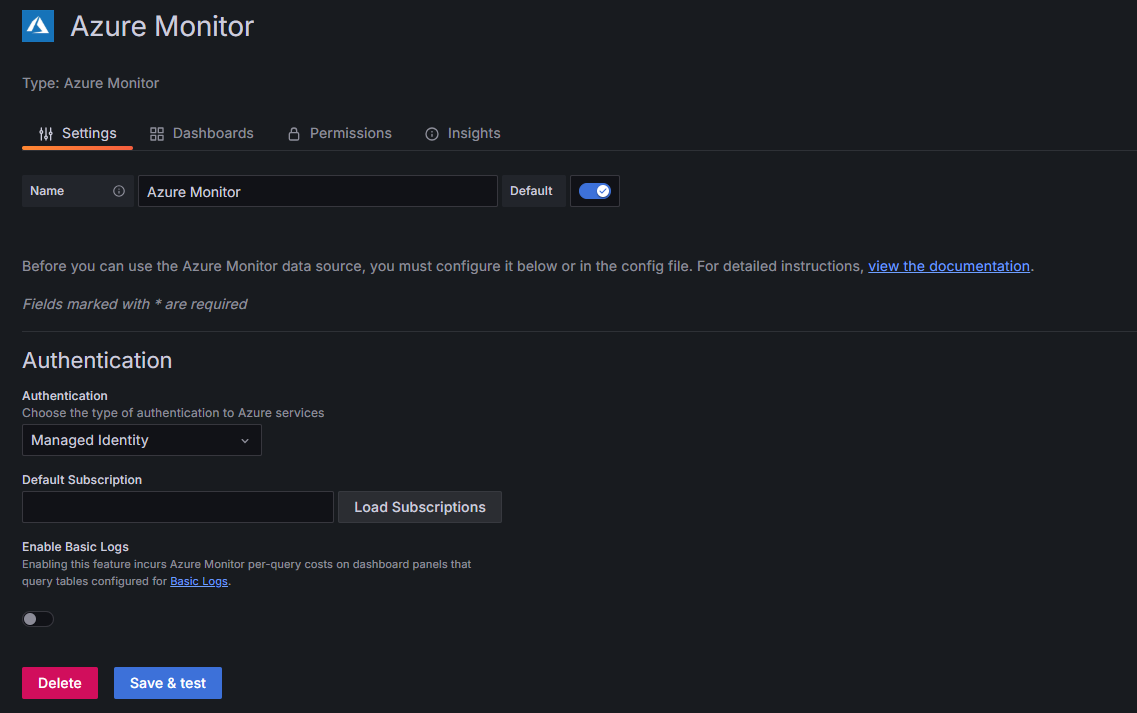
- A Foundry resource, with the Azure Monitor data source configured to read metrics from your Foundry resource.
Import the Foundry dashboard
Import the prebuilt Foundry dashboard into your Grafana workspace.
In the Azure portal, open your Azure Managed Grafana workspace and select the Endpoint URL to open the Grafana portal.
In the Grafana portal, go to Dashboards > New > Import.
Under Find and import dashboards, enter the dashboard ID 24039.
Select Load.
Configure the import settings:
- Name: Optionally customize the dashboard name.
- Folder: Select a folder to organize your dashboard.
- Unique identifier (UID): Leave as default or customize.
- Azure Monitor: Select your Azure Monitor data source from the dropdown.
Note
Ensure your Azure Managed Grafana workspace has the Monitoring Reader role on the subscription, resource group, or specific Foundry resource. If not, assign the role to the workspace's managed identity.
Select Import.
After importing the dashboard, use the dropdown selectors at the top of the dashboard to filter your specific Foundry resource.
Tip
You can also import this dashboard directly from the Azure portal. Go to Monitor > Dashboards with Grafana (preview), and select AI Foundry, or go to AI Foundry dashboard.


Customize the dashboard
Customize the dashboard to your specific monitoring needs.
To add a new panel:
Select Edit > Add > Visualization at the top of the dashboard.
Configure the query:
- Data source: Select Azure Monitor.
- Resource: Choose your Foundry resource.
- Metric namespace: Select the appropriate namespace (for example,
Microsoft.CognitiveServices/accounts). - Metric: Choose the metric to display (for example,
TokenTransaction,Latency). For a complete list of available metrics, see Foundry metrics. - Aggregation: Select the aggregation method (Average, Sum, Count, Min, Max).
Configure visualization options:
- Panel title: Enter a descriptive title.
- Visualization type: Choose from Time series, Stat, Gauge, Bar chart, Table, or other types.
- Unit: Set the appropriate unit (percent, milliseconds, requests/sec, etc.).
- Thresholds: Define warning and critical thresholds for visual alerts.
Select Apply to add the panel to your dashboard.
Technical details
The dashboard queries Azure Monitor Metrics using the following setup:
- Resource type:
Microsoft.CognitiveServices/accounts - Key metrics:
AzureOpenAIRequests— API call volume and success ratesTokenTransaction— Total inference tokens for cost trackingProcessedPromptTokens— Input tokens consumedGeneratedTokens— Output tokens producedAzureOpenAITTLTInMS— Inference latency (time to last byte)
- Grouping: All metrics split by
ModelDeploymentNamefor per-deployment analysis - Aggregations: Total for throughput and cost metrics, average for latency
Related content
- Create dashboards in Azure Managed Grafana
- Monitor model deployments in Foundry Models
- Create an Agent Framework dashboard – Monitor individual AI agent operations, costs, and traces
- Create an Agent Framework Workflow dashboard – Monitor multi-agent workflow execution and executor performance