Note
Access to this page requires authorization. You can try signing in or changing directories.
Access to this page requires authorization. You can try changing directories.
Parameters are the building blocks for filters in Real-Time Dashboards. You manage them at the dashboard level and add them to queries to filter the data shown in a visual. A query can use one or more parameters.
This article explains how to create and use parameters, cross-filters, and drillthroughs in dashboards. You can filter dashboard visuals either by selecting parameter values in the filter bar or by using cross-filters.
The query examples used in this article are based on the StormEvents table in the Weather analytics sample data available in the samples gallery.
Note
You can manage parameters only in Editing mode for dashboard editors.
Prerequisites
- A workspace with a Microsoft Fabric-enabled capacity.
- Editor permissions on a Real-Time Dashboard
- A dashboard with visuals
View parameters list
To view the list of all dashboard parameters, select Manage > Parameters.
Create a parameter
To create a parameter:
- Select the New parameter button on the top menu. The Parameters pane opens.
- Select + Add at the top of the right pane.
- Fill in the relevant properties for your parameter.
- Select Done to create the parameter.
Properties
In the Add parameter pane, configure the following properties.
| Field | Description |
|---|---|
| Label | The name of the parameter shown on the dashboard or edit card. |
| Parameter type | One of the following parameter types: - Single selection: Lets users select one value in the filter. - Multiple selection: Lets users select one or more values in the filter. - Time range: Adds time-based parameters to filter queries and dashboards. Every dashboard includes a time range picker by default. - Free text: Lets users type or paste a value into the filter. The filter keeps the most recently used values. - Data source: Lets users select one or more dashboard data sources. |
| Description | Optional description of the parameter. |
| Variable name | The parameter name that you use in the query. |
| Data type | The data type of the parameter values. |
| Show on pages | The pages where this parameter appears. Select all shows the parameter on all pages. |
| Source | The source of the parameter values: - Fixed values: Manually entered static filter values. - Query: Values returned by a KQL query. |
| Add "Select all" value | Applies only to single-selection and multiple-selection parameter types. Use this option to retrieve data for all parameter values. Build support for this option into the query. For an example, see Use a multiple-selection query-based parameter. |
| Default value | The value that the filter uses when the dashboard first renders. |
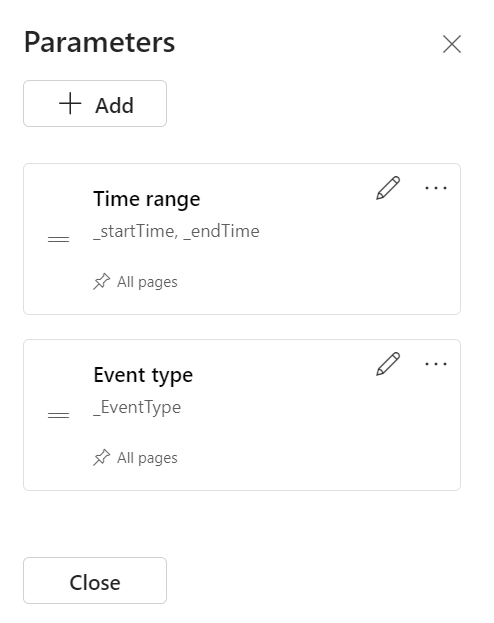
Manage parameters
After you select Parameters on the top bar, you can view the list of existing parameters. In each parameter card, select the edit icon to modify the parameter, or select More [...] to duplicate, delete, or move it.
You can view the following indicators in the parameter card:
- Parameter display name.
- Variable name.
- Number of queries that use the parameter.
- Pages where the parameter appears.
You can reorder parameter cards by drag-and-drop or by using Move to >.
Use parameters in your query
A parameter must be used in the query before the filter affects that visual. After you define a parameter, you can see it in the filter bar on the Query page and in query IntelliSense.
Note
If the query doesn't use the parameter, the filter remains inactive. When you add the parameter to the query, the filter becomes active.
Parameter types
The dashboard supports the following parameter types:
- Default time range parameter
- Single-selection fixed-values parameters
- Multiple-selection fixed-values parameters
- Single-selection query-based parameters
- Multiple-selection query-based parameters
- Free text parameters
- Data source parameters
The following examples describe how to use parameters in a query for various parameter types.
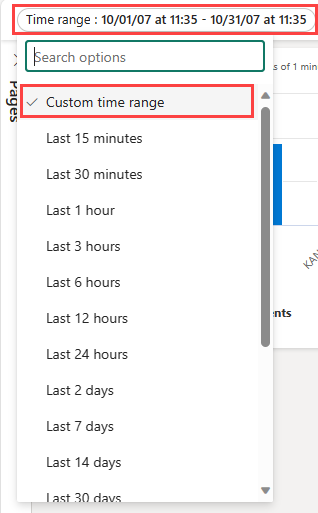
Default time range parameter
Every dashboard includes a Time range parameter by default. It appears as a filter only when you use it in a query. Use the _startTime and _endTime keywords to apply the default time range parameter, as shown in the following example:
StormEvents
| where StartTime between (_startTime.._endTime)
| summarize TotalEvents = count() by State
| top 5 by TotalEvents
When you save the query, the time range filter appears on the dashboard. You can then filter the visual by selecting a preset in Time range or by selecting Custom time range.
Single-selection fixed-values parameters
Fixed value parameters are based on predefined values that you specify. The following example shows how to create a single-selection, fixed-value parameter.
Create a single-selection fixed-values parameter
Select Parameters to open the Parameters pane, and then select New parameter.
Enter the following details:
Label: Event Type
Parameter type: Single selection
Variable name:
_eventTypeData type: String
Pin as dashboard filter: Selected
Source: Fixed values
In this example, use the following values:
Value Parameter display name Thunderstorm Wind Thunderstorm wind Hail Hail Flash Flood Flash flood Drought Drought Winter Weather Winter weather Add a Select all value: Unchecked
Default value: Thunderstorm Wind
Select Done to create the parameter.
The parameter appears in the Parameters pane, but you aren't using it in any visuals yet.
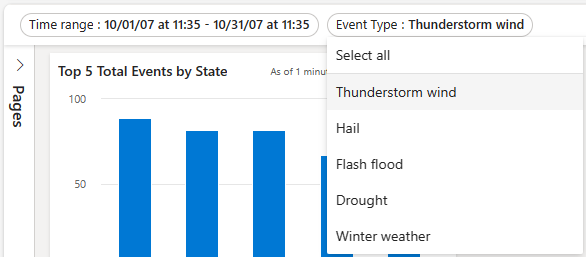
Use a single-selection fixed-values parameter
Run a sample query that uses the new Event Type parameter by using the
_eventTypevariable name:StormEvents | where StartTime between (_startTime.._endTime) | where EventType == _eventType | summarize TotalEvents = count() by State | top 5 by TotalEventsThe new parameter appears in the parameter list at the top of the dashboard.
Select different values to update the visuals.
Multiple-selection fixed-values parameters
Fixed value parameters are based on predefined values that you specify. The following example shows how to create and use a multiple-selection fixed-value parameter.
Create a multiple-selection fixed-values parameter
Select Parameters to open the Parameters pane, and then select New parameter.
Fill in the details as described in Create a single-selection fixed-values parameter, with the following changes:
- Label: Event Type
- Parameter type: Multiple selection
- Variable name:
_eventType
Select Done to create the parameter.
The new parameter appears in the Parameters pane, but you aren't using it in any visuals yet.
Use a multiple-selection fixed-values parameter
Run a sample query that uses the new Event Type parameter and the
_eventTypevariable.StormEvents | where StartTime between (_startTime.._endTime) | where EventType in (_eventType) or isempty(_eventType) | summarize TotalEvents = count() by State | top 5 by TotalEventsThe new parameter appears in the parameter list at the top of the dashboard.
Select one or more different values to update the visuals.

Single-selection query-based parameters
Query-based parameter values are retrieved during dashboard loading by executing the parameter query. The following example shows you how to create and use a single-selection, query-based parameter.
Create a single-selection query-based parameter
Select Parameters to open the Parameters pane, and then select New parameter.
Fill in the details as described in Create a single-selection fixed-values parameter, with the following changes:
Label: State
Variable name:
_stateSource: Query
Data source: StormEventsSample
Select Edit query and enter the following query. Select Done.
StormEvents | where StartTime between (_startTime.._endTime) | where EventType in (_eventType) or isempty(_eventType) | summarize TotalEvents = count() by State | top 5 by TotalEvents | project StateValue: State
Display name: State
Default value: Choose a default value
Select Done to create the parameter.
Use a single-selection query-based parameter
The following sample query with the new State parameter uses the
_statevariable:StormEvents | where StartTime between (_startTime.._endTime) | where EventType in (_eventType) or isempty(_eventType) | where State == _state | summarize TotalEvents = count() by State | top 5 by TotalEventsThe new parameter appears in the parameter list at the top of the dashboard.
Select different values to update the visuals.
Multiple-selection query-based parameters
Query-based parameter values come from running a user-specified query when the dashboard loads. The following example shows how to create a multiple-selection query-based parameter.
Create a multiple-selection query-based parameter
Select Parameters to open the Parameters pane, and then select + New parameter.
Enter the details as described in Create a single-selection query-based parameter, with the following changes:
- Label: State
- Parameter type: Multiple selection
- Variable name:
_state
Select Done to create the parameter.
Use a multiple-selection query-based parameter
The following sample query uses the new State parameter by using the
_statevariable.StormEvents | where StartTime between (_startTime.._endTime) | where EventType in (_eventType) or isempty(_eventType) | where State in (_state) or isempty(_state) | summarize TotalEvents = count() by State | top 5 by TotalEventsNote
This sample uses the Select All option by checking for empty values with the
isempty()function.The new parameter appears in the parameter list at the top of the dashboard.
Select one or more different values to update the visuals.
Free text parameters
Free text parameters don't contain any values. They allow you to introduce your own value.
Create a free text parameter
- Select Parameters to open the Parameters pane, and then select + New parameter.
- Enter the following details:
- Label: State
- Parameter type: Free text
- Variable name:
_state - Data type: String
- Default value: No default value
- Select Done to create the parameter.
Use a free text parameter
Run a sample query using the new State parameter by using the
_statevariable name:StormEvents | where StartTime between (_startTime.._endTime) | where EventType in (_eventType) or isempty(_eventType) | where State contains _state | summarize TotalEvents = count() by State | top 5 by TotalEvents
Data source parameters
After you add data sources to your dashboard, you can create a parameter that selects one or more of the available data sources. Use this parameter in tiles and other parameters.
Create a data source parameter
Select Parameters to open the Parameters pane, and then select + New parameter.
Enter the following details:
- Label: Source
- Parameter type: Data source
- Show on pages: Select all
- Values: Select all
- Default value: StormEvents
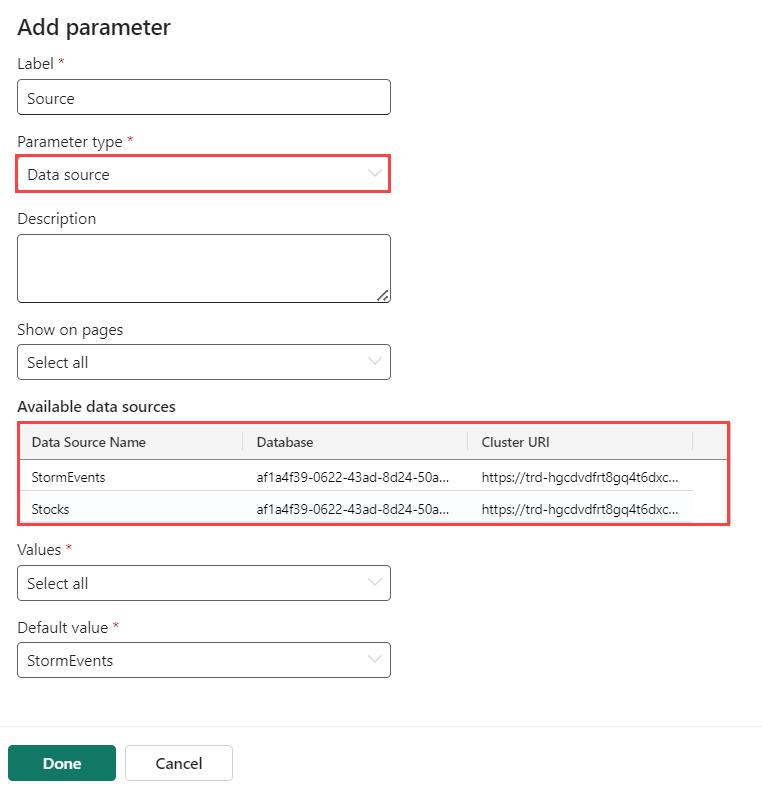
Select Done.
The parameter list at the top of the dashboard now shows the new parameter.
Use a data source parameter
Go to the query of a new or existing tile.
In Source, select the name of your new parameter under Data source parameters, such as the new Source parameter.
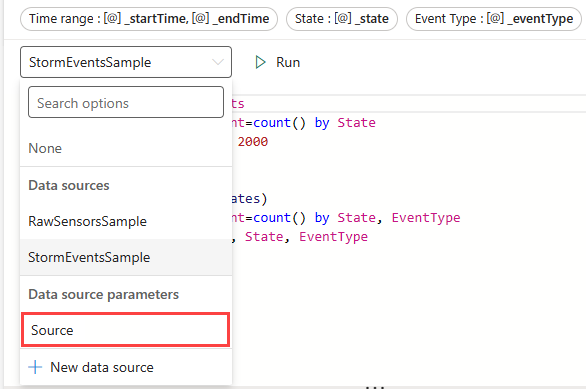
Select Apply changes.
Use the Source parameter to change the data source for this connected query.
Cross-filter parameters
A cross-filter is a feature in a dashboard that you use to select a value in one visual and filter the data in other visuals on the same dashboard. Using cross-filters achieves the same result as selecting the equivalent value for the parameter in the parameter list at the top of the dashboard.
Define cross-filters
To create a cross-filter, turn on the option in the visual, and then specify the parameter that filters the data.
Go to the query of the tile where you want to add cross-filters.
Select Visual.
In the right pane, select Interactions, and then turn on cross-filters.
Optionally, specify the Interaction type. The default is Point where you select a value in the visual. For selecting a range of values, such as in a time chart, select Drag.
Specify both the column that provides the value and a parameter that filters the visuals' query.
Important
The column and parameter must be of the same data type.
Interact with your data by using cross-filter
After you define the cross-filter, use it to interact with your data. In visuals where you define cross-filters, select data points and use their values to filter the current dashboard page. For table visuals, right-click the relevant cell, and then select Cross-filter.
You can reset the cross-filter by selecting Reset at the top of the visual where you selected it.

Use drillthroughs as dashboard parameters
Drillthroughs let you select a value in a visual and use it to filter visuals on a target page in the same dashboard. When the target page opens, the value is preselected in the relevant filters. The visuals on the page, such as line or scatter charts, show only related data. This feature is useful when you want to drill through from a summary page to a details page. For information about creating pages, see Add page.
Define a drillthrough
To create a drillthrough, turn on the option in the visual, and then specify one or more drillthrough parameters that filter the data.
On your primary page, enter Editing mode.
Edit the visual where you want to add a drillthrough. Make sure that the Visual tab is selected.
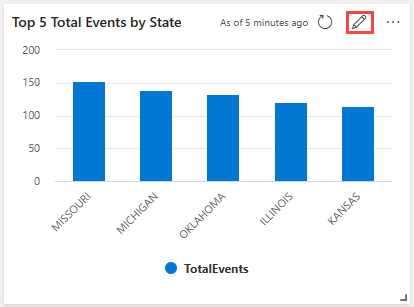
In the right pane, select Interactions, and then turn on drillthrough.
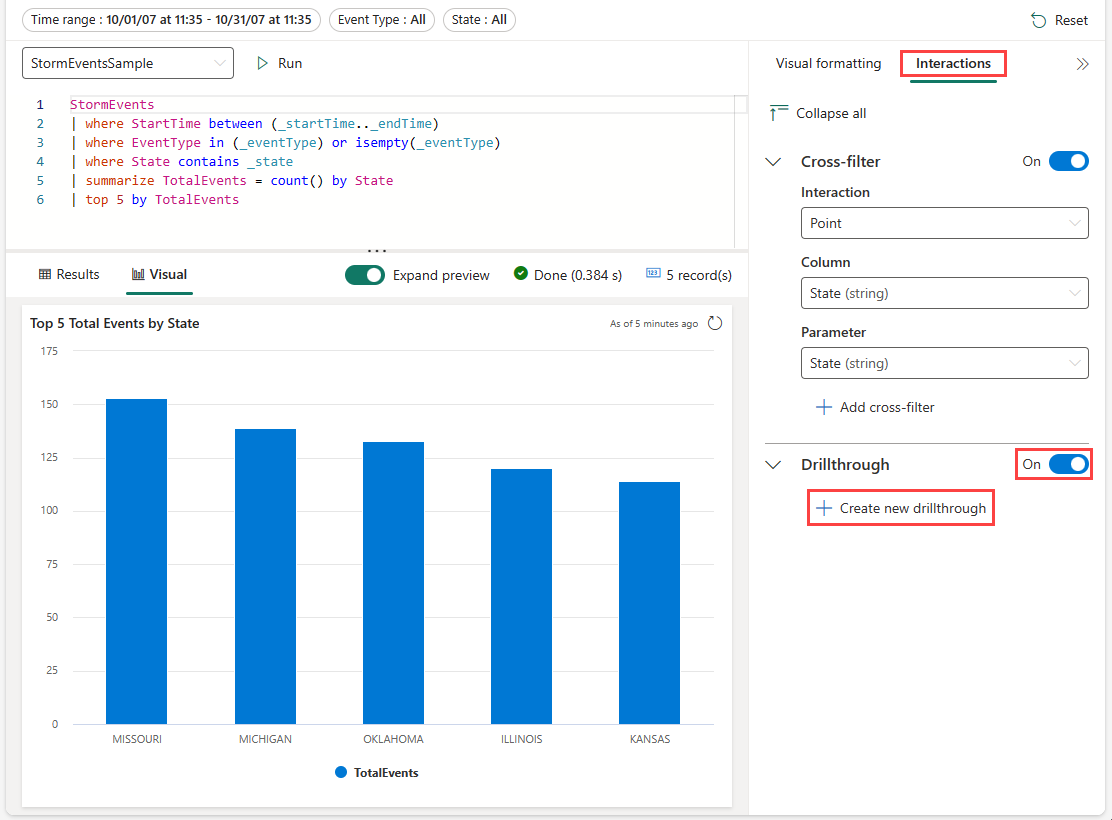
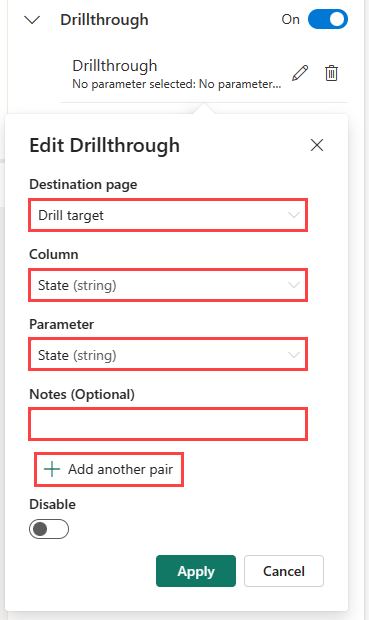
Under Drillthrough, select Create new, and specify the following information. Optionally select Add another pair to add multiple parameters for a target page. Repeat this step to add drillthroughs to other pages in the current dashboard by using different parameters.
Field Description Destination page One or more target pages to drill through to by using the defined parameters. Column The query result's column to use as the value for a parameter in the target page. Parameter The parameter used to filter visuals in the target page by using the column value. Notes Optional short description. Important
Column and parameter pairs must be of the same data type.
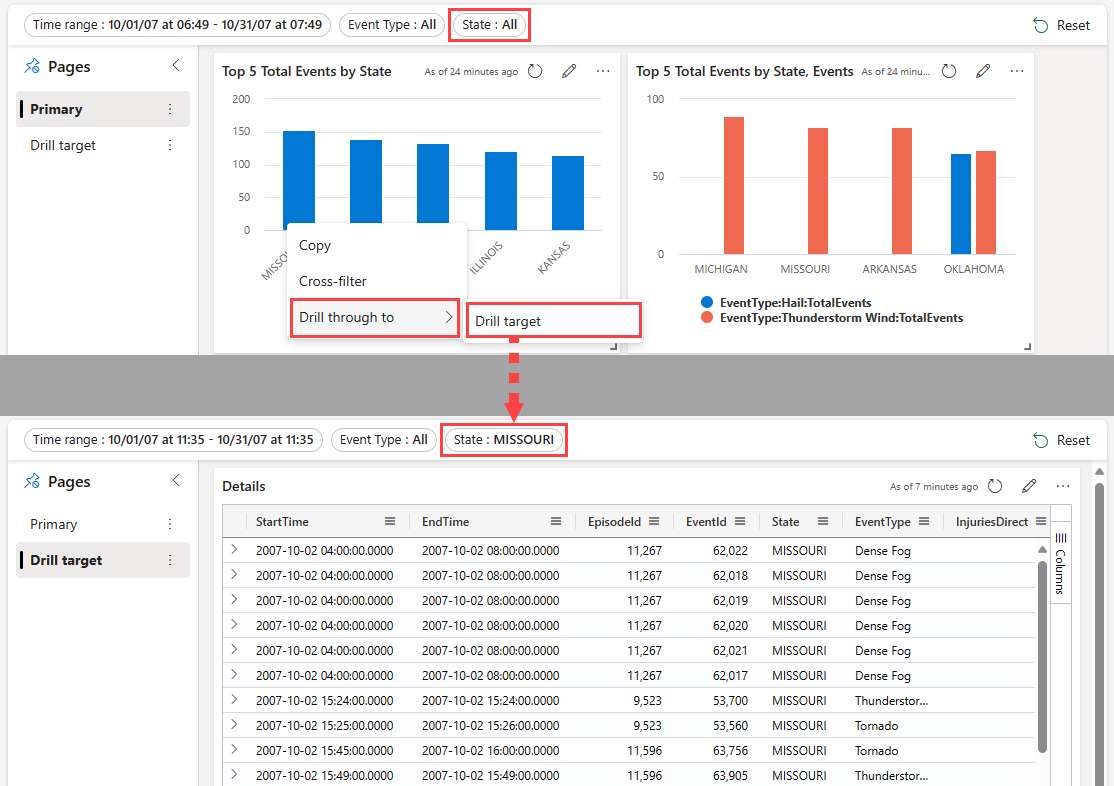
Interact with your data by using drillthroughs
After you define drillthroughs, use them to interact with your data. In visuals or tables where you define a drillthrough, right-click a data point, and then select Drill through to > destination page. The values from the data point filter the visuals on the target page.
Use filter search for single-selection and multiple-selection filters
In single-selection and multiple-selection filters, type the value that you want. The filter updates to show only values that match the search term.