Note
Access to this page requires authorization. You can try signing in or changing directories.
Access to this page requires authorization. You can try changing directories.
In this article, you learn how to connect a KQL database as a data source in Power BI Desktop. After you connect, you can use multiple tables to build Power BI reports.
To create reports in the Power BI service by using a KQL queryset, see Create a Power BI report.
Prerequisites
- A workspace with a Microsoft Fabric-enabled capacity.
- A KQL database with data.
- Power BI Desktop.
Connectivity modes
Power BI supports Import and DirectQuery connectivity modes. When you build Power BI reports, choose the mode that fits your scenario, scale, and performance requirements. Import mode copies your data to Power BI. DirectQuery mode queries your data directly from your KQL database.
Use Import mode when:
- Your data set is small and you don't need near real-time data.
- You perform aggregation functions.
Use DirectQuery mode when:
- Your data set is large or you need near real-time data.
For more information on connectivity modes, see DirectQuery in Power BI.
Connect to the data source
Launch Power BI Desktop.
On the Home tab, select OneLake catalog > KQL Databases.
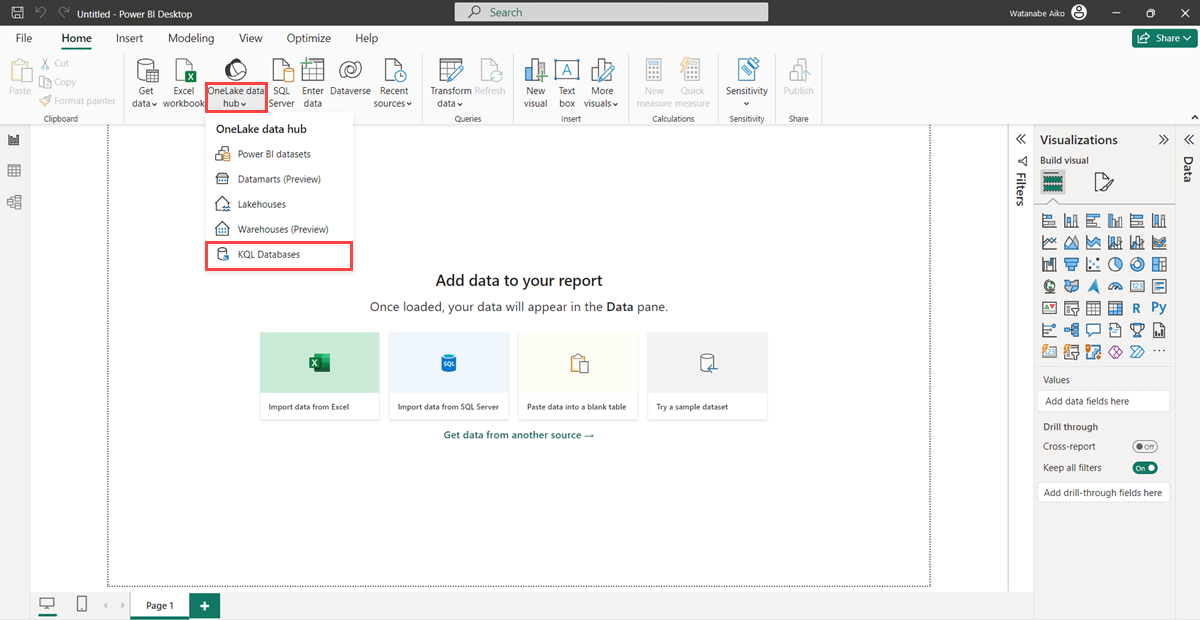
The OneLake catalog window displays a list of KQL databases that you can access.
Select a KQL database to use as a data source in Power BI, and then select Connect.
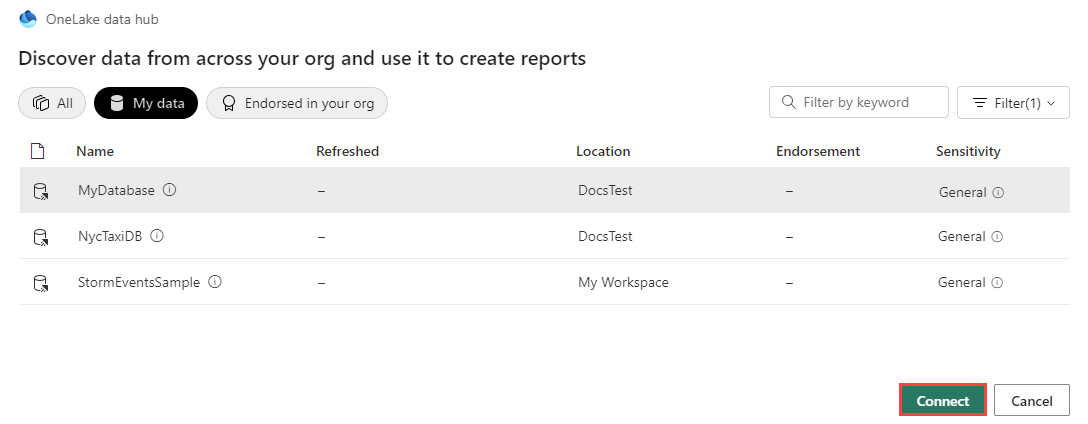
Enter your credentials in the authentication window.

Load data
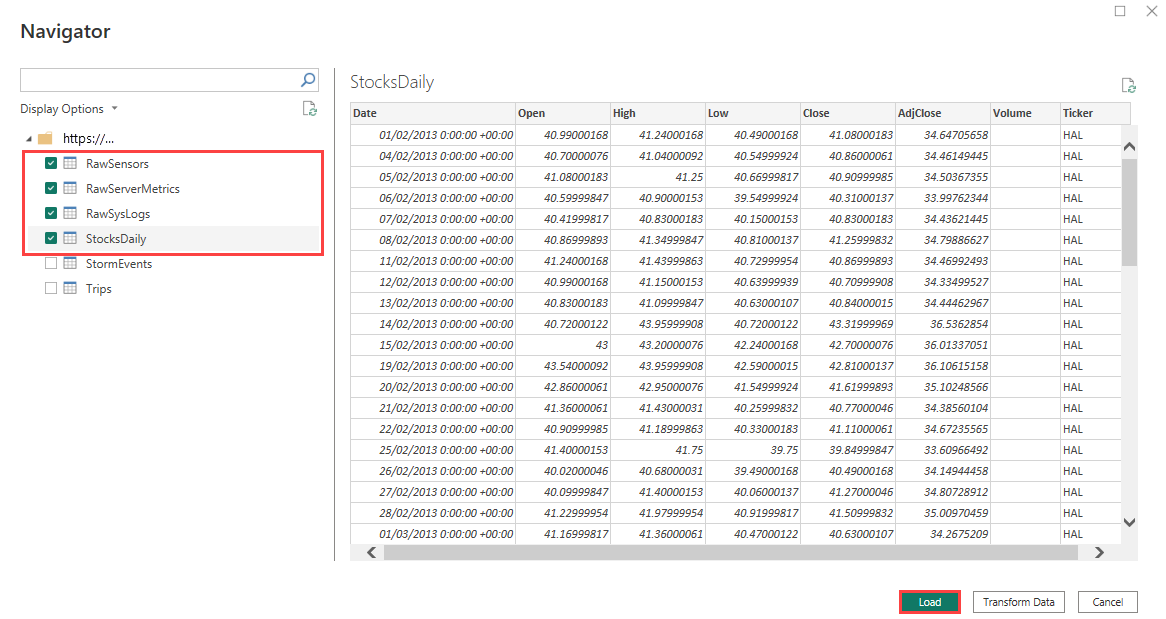
In the Navigator window, select the tables you want to connect, and then select Load.
If you want to shape your data first, select Transform data to open the Power Query Editor. For more information, see Transform and clean your data.
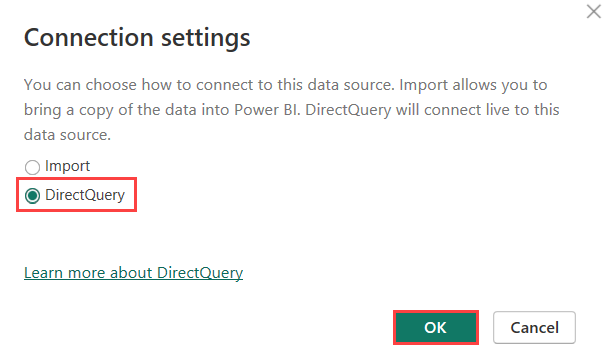
The Connection settings window lists the available connectivity modes. The mode determines whether Power BI imports the data or connects directly to the data source. For more information, see Connectivity modes.
Select DirectQuery to connect directly to the data source, and then select OK.
You connected your KQL database as a data source in Power BI Desktop. You can now visualize your data in a Power BI report.